The file hondt.e contains an implementation of the d'Hondt and the Hare-Niemeyer procedures for elections.
>load hondt;
Let us start with a simple example. Assume the votes are the following.
>v=[24,27,5]
[24, 27, 5]
Now we have 10 seats. How would distribute these seats?
The d'Hondt method does the following.
>hondt(v,10)
[4, 5, 1]
The result of the Hare-Niemeyer method is the same in this case.
>hnbest(v,10)
[4, 5, 1]
The d'Hondt method divides the seats by 1, 2, 3, ... and sorts the results. Then it takes the highest n numbers to determine the seats.
Let us simulate that. First we divide all elements of v by 1 to 10 and put that into one vector.
>k=10; vh=redim(v/(1:k)',1,k*3)
[24,  27,  5,  12,  13.5,  2.5,  8,  9,  1.66667,  6,  6.75,  1.25,
4.8,  5.4,  1,  4,  4.5,  0.833333,  3.42857,  3.85714,  0.714286,  3,
3.375,  0.625,  2.66667,  3,  0.555556,  2.4,  2.7,  0.5]
Here are the numbers of the parties for each entry of vh.
>ph=redim(dup(1:3,k),1,k*3)
[1,  2,  3,  1,  2,  3,  1,  2,  3,  1,  2,  3,  1,  2,  3,  1,  2,  3,
1,  2,  3,  1,  2,  3,  1,  2,  3,  1,  2,  3]
Now we sort vh in descending order.
>{vhs,is}=sort(-vh); -vhs
[27,  24,  13.5,  12,  9,  8,  6.75,  6,  5.4,  5,  4.8,  4.5,  4,
3.85714,  3.42857,  3.375,  3,  3,  2.7,  2.66667,  2.5,  2.4,
1.66667,  1.25,  1,  0.833333,  0.714286,  0.625,  0.555556,  0.5]
The parties which these numbers belong to, are the following.
>ph[is]
[2,  1,  2,  1,  2,  1,  2,  1,  2,  3,  1,  2,  1,  2,  1,  2,  2,  1,
2,  1,  3,  1,  3,  3,  3,  3,  3,  3,  3,  3]
We now take the first 10 values of the vector, determine the parties of these indices, and count the number of times a party occurs.
>is=is[1:10], ps=ph[is], getmultiplicities(1:3,ps)
[2,  1,  5,  4,  8,  7,  11,  10,  14,  3]
[2,  1,  2,  1,  2,  1,  2,  1,  2,  3]
[4,  5,  1]
Hare-Niemeyer works with a different, and less obscure trick. First we determine the fractional number of seats each party should get.
>s=v/sum(v)*10
[4.28571, 4.82143, 0.892857]
This is of course not possible. Therefore, we give the parties the integer part of this, thus
![]()
>sp=floor(s)
[4, 4, 0]
We have 2 seats left. Now we determine the errors for each party and add 1 seat for the highest 2 errors.
>s-sp, {h,i}=sort(s-sp); i=i[-2:-1],
[0.285714,  0.821429,  0.892857]
[2,  3]
Party 2 and 3 have the largest error. So we reduct this error the most, if we add one seat to 2 and 3.
>sp[i]=sp[i]+1; sp,
[4, 5, 1]
For a comparison, we assume two parties, where one gets p percent of the votes, and k seats. Then we can write a function for the number of seats the party gets.
>function map shondt (p) := hondt([p,1-p],k)[1]
Now we can plot the number of seats the party gets versus the number of seats it should get (in red).
>k=10; plot2d("k*x",0,1,color=red); ...
 plot2d("shondt",>add):
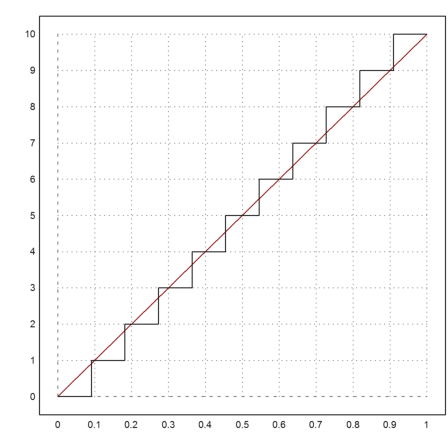
This tends to put the smaller party at a disadvantage.
Let us try the same with Hare-Niemeyer.
>function map shn (p) := hnbest([p,1-p],k)[1]; ...
 k=10; plot2d("k*x",0,1,color=red); ...
 plot2d("shn",>add):
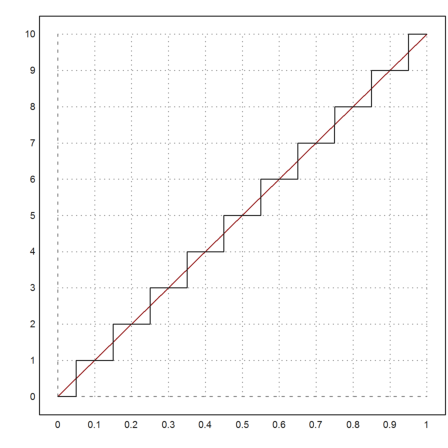
This clearly looks much better. In fact, it rounds the fractional number of seats to the next integer.
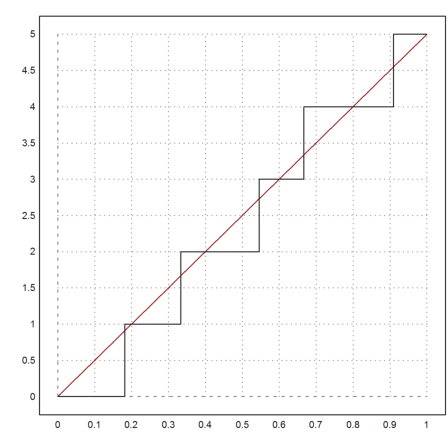
We can do the same for three parties with an equal share of votes for the other two.
>function map shondt (p) := hondt([p,1-p/2,1-p/2],k)[1]; ...
 k=10; plot2d("k*x/2",0,1,color=red); ...
 plot2d("shondt",>add):
>function map shn (p) := hnbest([p,1-p/2,1-p/2],k)[1]; ...
 k=10; plot2d("k*x/2",0,1,color=red); ...
 plot2d("shn",>add):
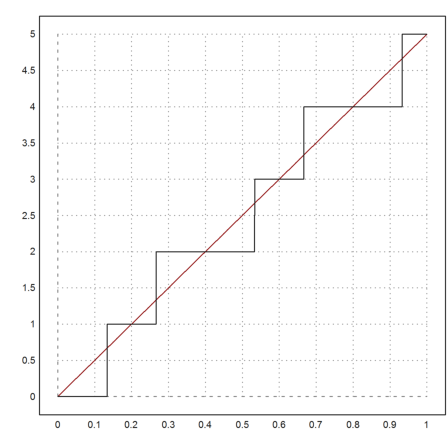
Again the small party clearly gets a fair share.